RICS Construction productivity report 2023
-
 Email
Email
-
 Facebook
-
 Linkedin
-
 Twitter
-
 Whatsapp
04 July 2023
Anil Sawhney, Simon Rubinsohn, and Donglai Luo
1. Background
Construction productivity has a reputation for being among the lowest across all industry sectors. A report published in 2017 by McKinsey Global Institute (which also appeared in an article by the Economist), stated that construction sector productivity has largely remained stagnant over the past several decades. The McKinsey study also claimed that the construction sector could save $1.6 trillion annually by bringing the sector productivity in line with the average productivity across other economic sectors. To some extent, the sector itself is to blame for this position because the performance at the individual project level is often below stakeholder expectations, sometimes damaging levels of trust and the sector’s public image.
Construction productivity is a reasonably simple concept as it is a ratio of output to input, however, the challenge is in defining output and input precisely. No clear definition or globally-agreed frameworks exist to improve productivity. Going forward, the sector must ensure that productivity is measured, reported and improved regularly.
Construction productivity is broadly measured at the sector, organisational, project and activity levels. While these levels are interconnected, each is defined, measured and used differently. The sector-level productivity considers overall economic and market conditions and is measured and reported by economists working for regional or national statistical organisations. For example, the overall sector-level productivity is stagnating due to an uncertain economic outlook in most markets during the second half of 2022 and the beginning of 2023. Organisational, project and activity level productivity is generally based on internal factors and measures the quantum of construction work produced per work hour of allocated resources. This measure requires rigorous site data collection and a regimented analysis and reporting process.
To assess the current organisational, project and activity-level construction productivity, we added four additional productivity-related questions to the third quarter of the RICS Global Construction Monitor (GCM) survey 2022:
1. How often do you measure labour productivity in your construction business?
- very frequently (every quarter)
- frequently (every six months)
- annually
- less than annually
- never
2. Has labour productivity increased in your business over the past 12 months?
- yes
- no, it has remained unchanged
- no, it has fallen
- not sure
3. Do you expect labour productivity to increase in your business over the next 12 months?
- yes, significantly
- yes, modestly
- no
- not sure
4. How do you plan to increase labour productivity in your business (select all that apply)?
- greater investment in automation
- greater investment in data/digitisation
- rationalisation of the structure of the industry through M&A
- increased focus on offsite construction
- improve procurement and supply chain management
- upskilling the workforce
- drawing on materials innovation
- not sure.
2. Findings
Responses from the online survey were analysed using a spreadsheet tool. Findings from the analysis are presented in the following sections of this report. The findings provided in this report are based on the Q3 GCM 2022 survey.
2.1 Frequency of measurement
The first additional question asked respondents to provide the frequency with which they measure construction productivity in their business. 29% of the respondents reported measuring organisational, project and activity level productivity every quarter, whereas 14% of respondents never measure productivity (see Figure 1). Figure 2 shows the regional variations in the responses to the frequency of measuring construction productivity. Using the Relative Importance Index (RII), the Americas ranks highest and Europe ranks the lowest in the frequency of productivity measurement (see Table 1).
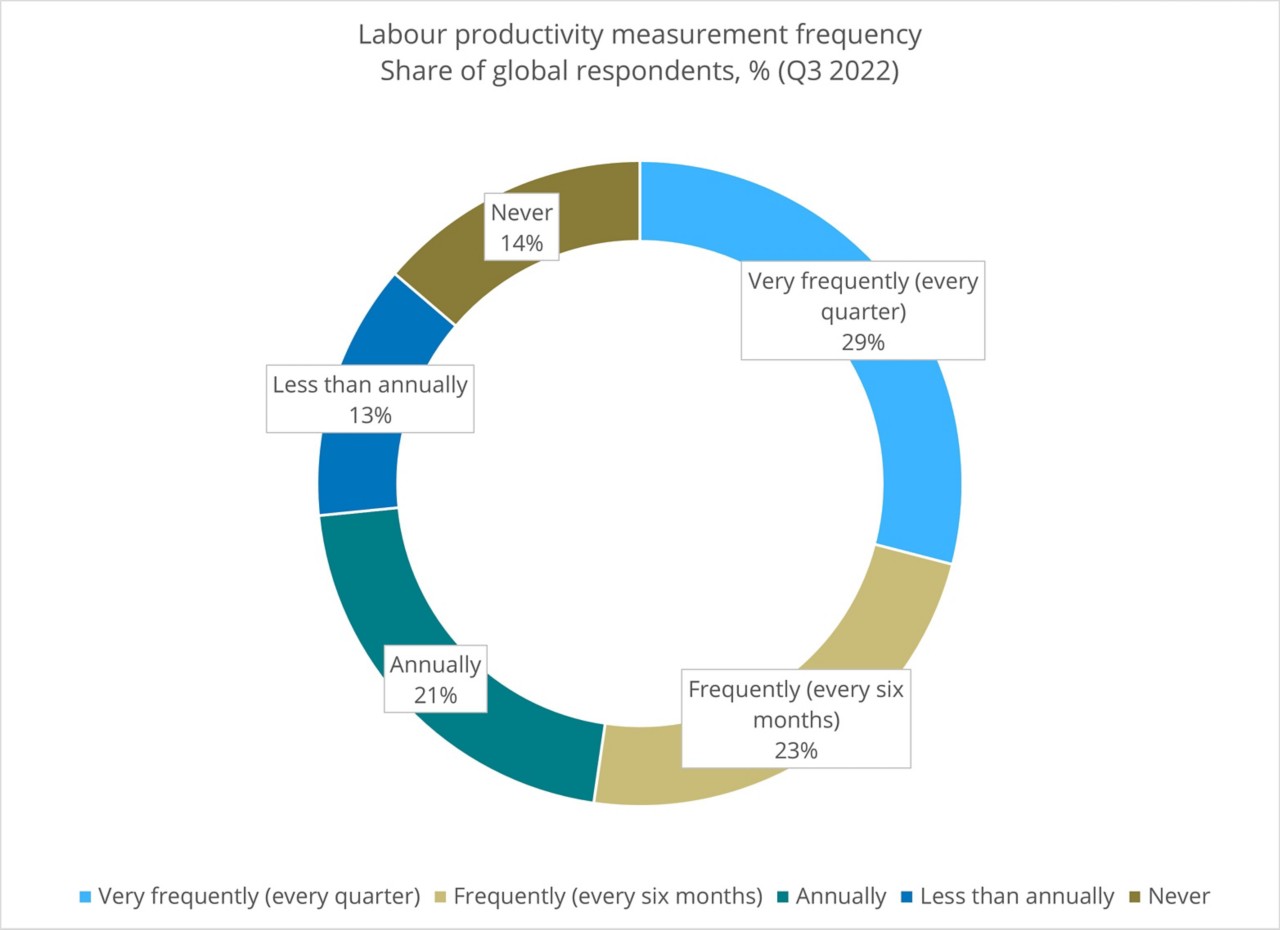
Figure 1: Frequency of measurement of construction productivity
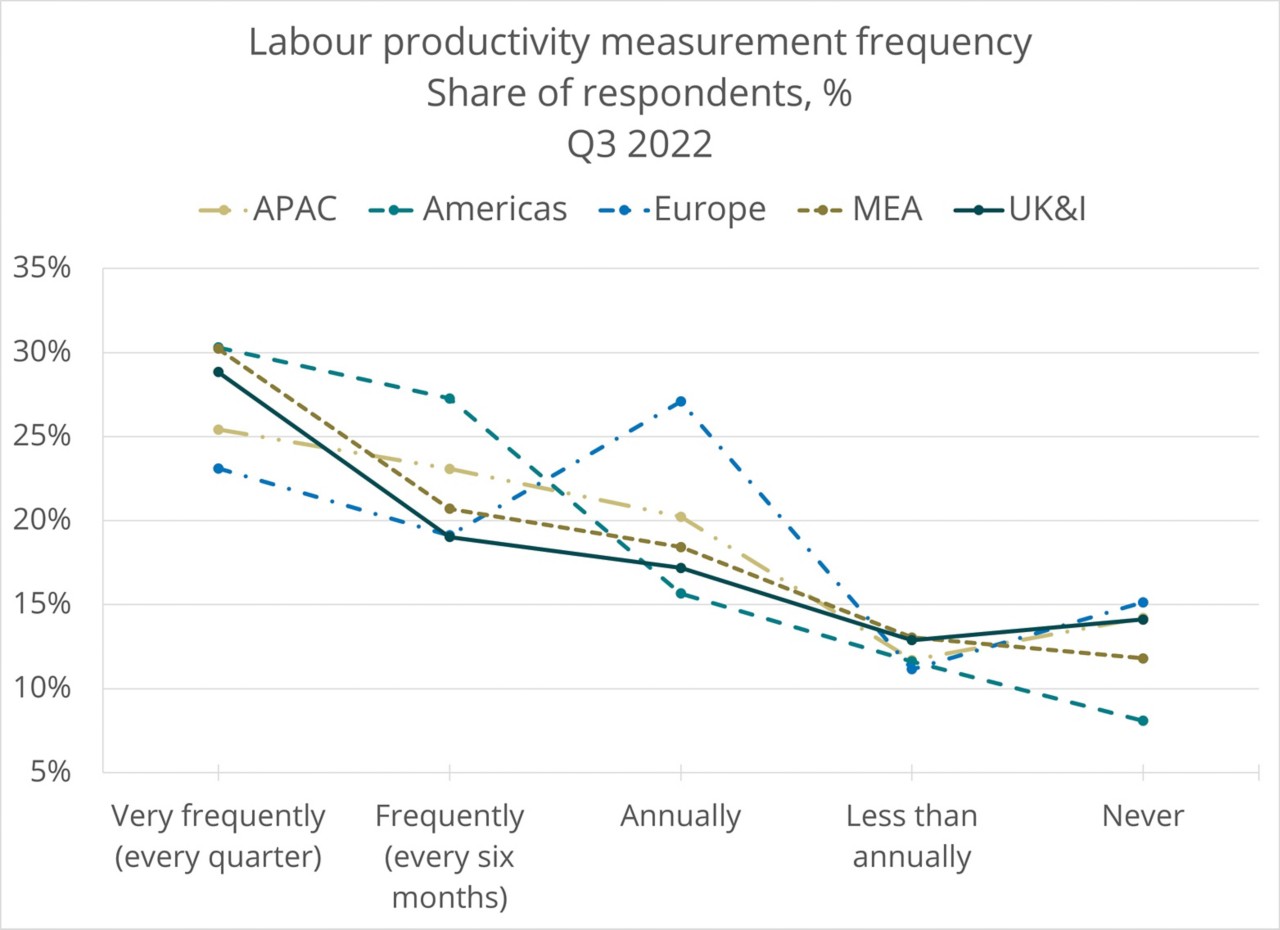
Figure 2: Regional variations in the frequency of measurement
2.2 Past 12 months and the next 12 months
In the second question, the respondents were asked to share their views on the increases in labour productivity in their business over the past 12 months. In the third question, the respondents were asked about the expected increase in labour productivity over the next 12 months. Figure 3 shows the responses to both questions. 21% of the respondents saw increased productivity in the last 12 months, while 45% did not see any change in productivity (Figure 3(a)). 9% of respondents expect labour productivity to increase over the next 12 months, while over 35% expect labour productivity to remain stagnant, with 42% expecting a modest increase (Figure 3(b)).
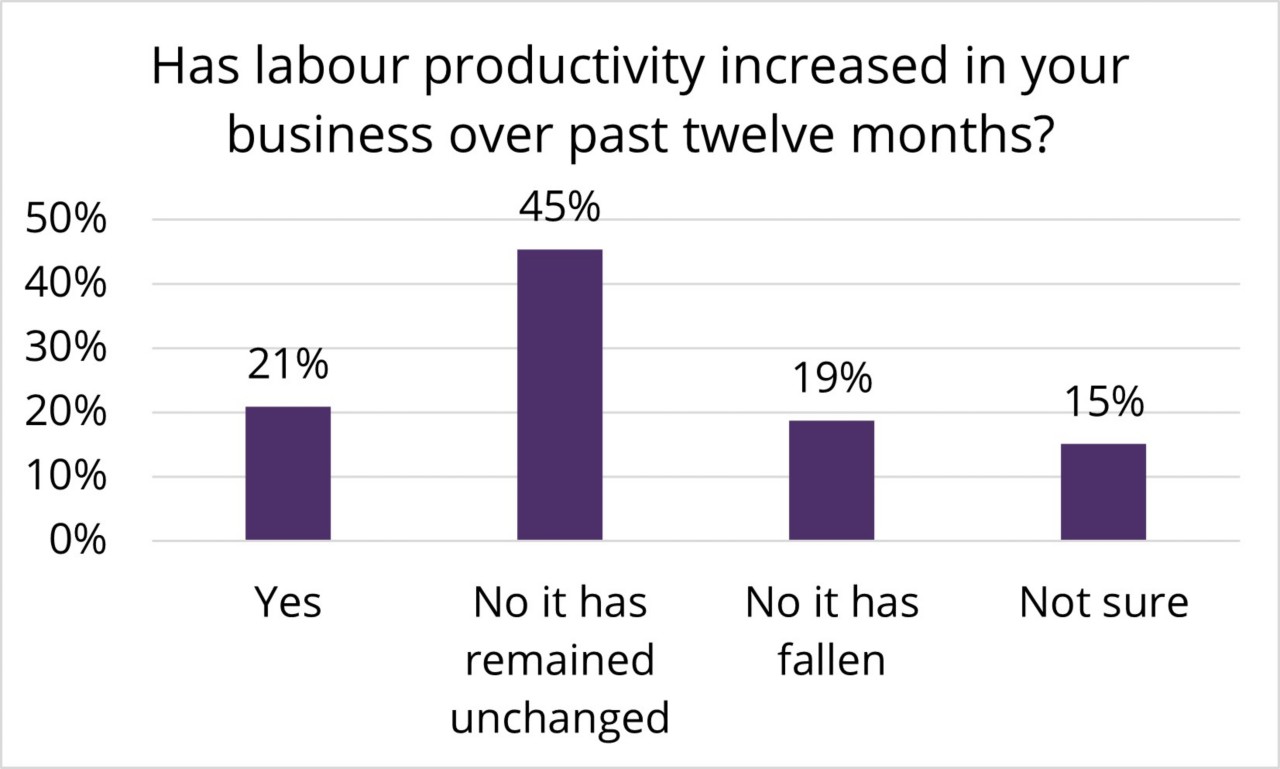
(a) Figure 3: Global responses to productivity outlook
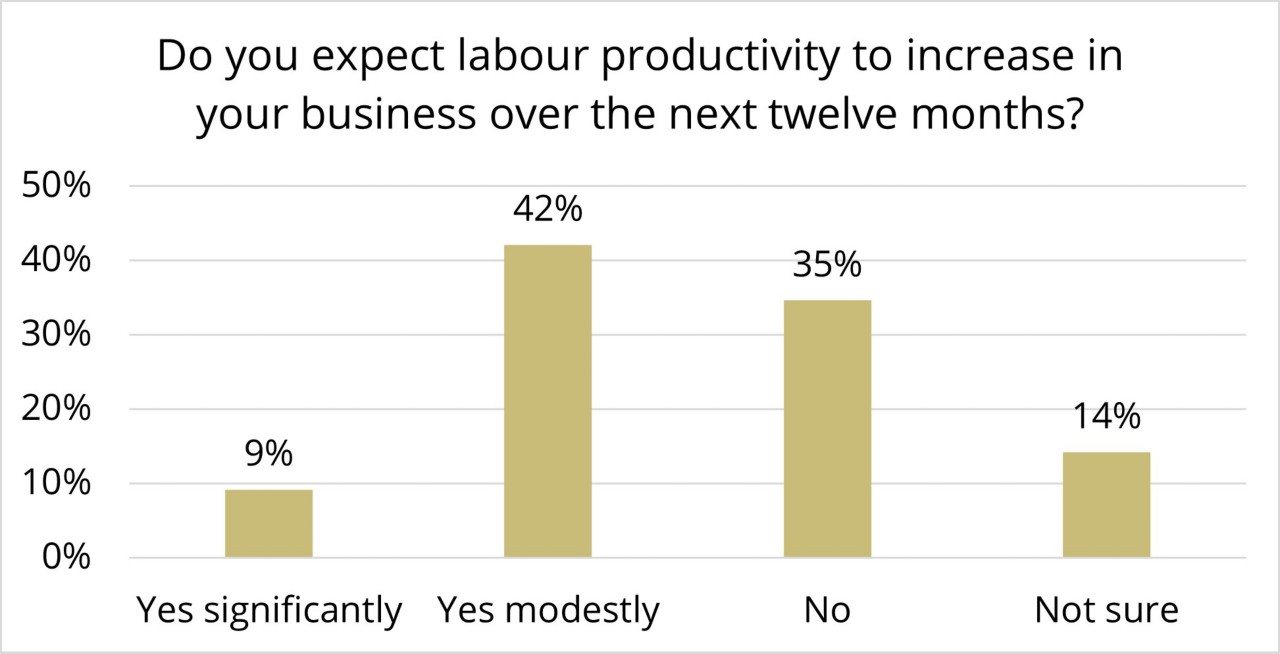
(b) Figure 3: Global responses to productivity outlook
Figure 4 shows construction productivity in the UK and Ireland for the past 12 months and the next 12 months. There is a downward trend in productivity when comparing the responses from the past 12 months with the next 12 months. However, compared to other parts of the world, the UK and Ireland have more respondents indicating increased labour productivity for the past 12 months and the next 12 months. Yet fewer people are optimistic about labour productivity for the next 12 months, with a reading of 39% versus 52% for the past 12 months.
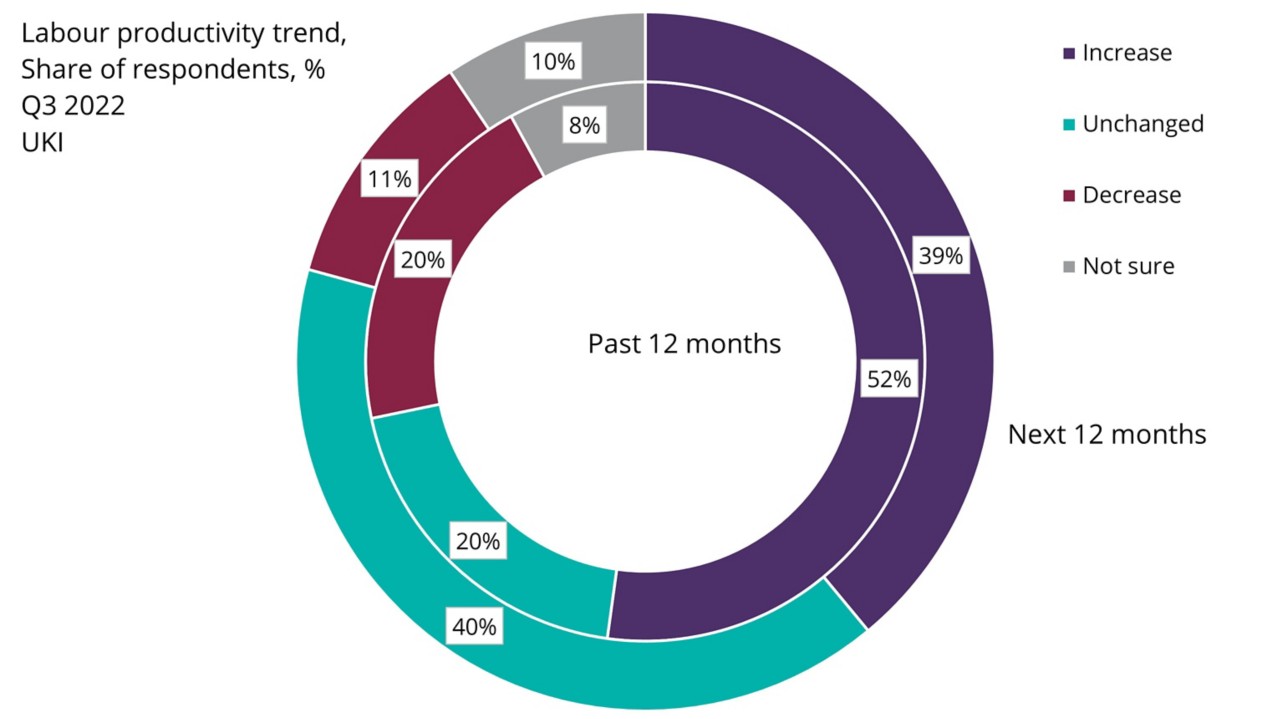
Figure 4: Productivity in the UK and Ireland
Besides the UK and Ireland region, in the other parts of the world, more respondents sound pessimistic about the prospect of labour productivity increases. Specifically, Europe and the Americas see a more significant increment in the share of respondents, indicating a decrease in labour productivity. Both doubled, from 14% to 37% and 21% to 43%, respectively.
Figure 5 shows the labour productivity in the Middle East and Africa for the past 12 months and the next 12 months. There is a significant downward trend in productivity, with a larger proportion of responses indicating an unchanged or decreasing productivity in the next 12 months.
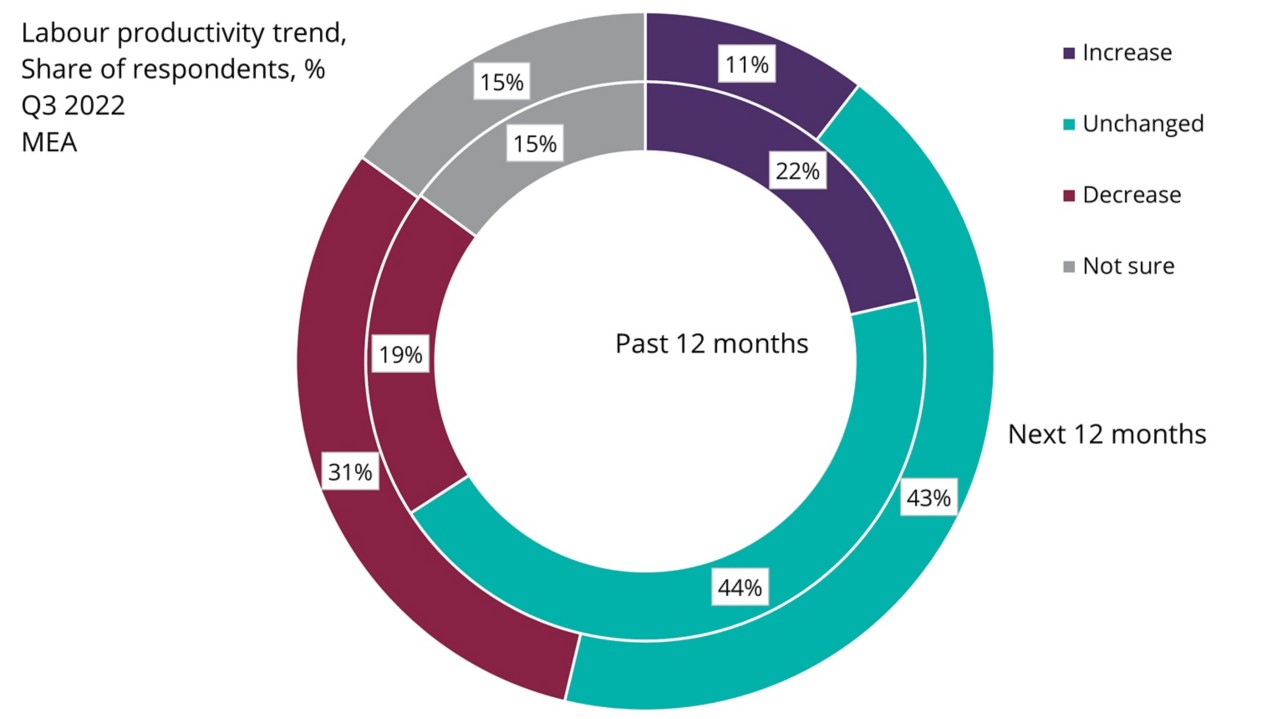
Figure 5: Productivity in MEA
Europe also has growing pessimism, with a larger share of respondents indicating unchanged or decreasing productivity (see Figure 6).
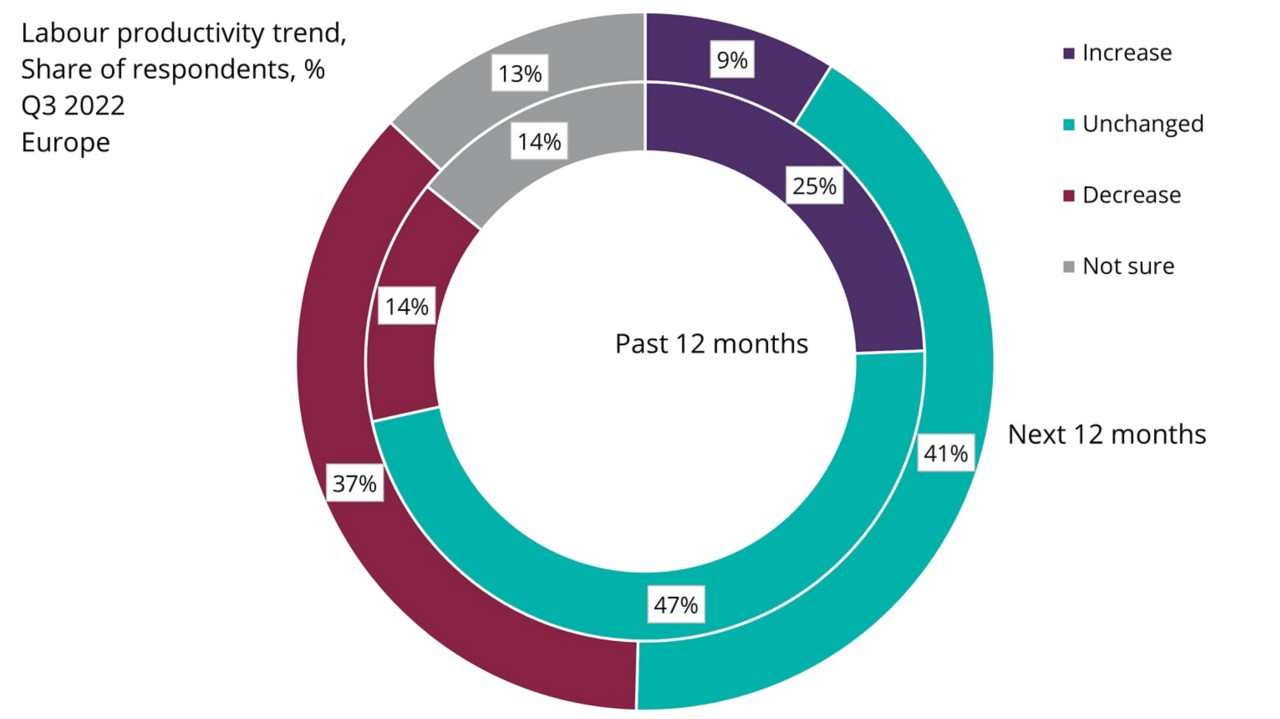
Figure 6: Productivity in Europe
In the Americas, 19% of respondents saw an increase in construction productivity over the preceding 12 months, while only 3% expected productivity to increase in the upcoming 12 months (see Figure 7).
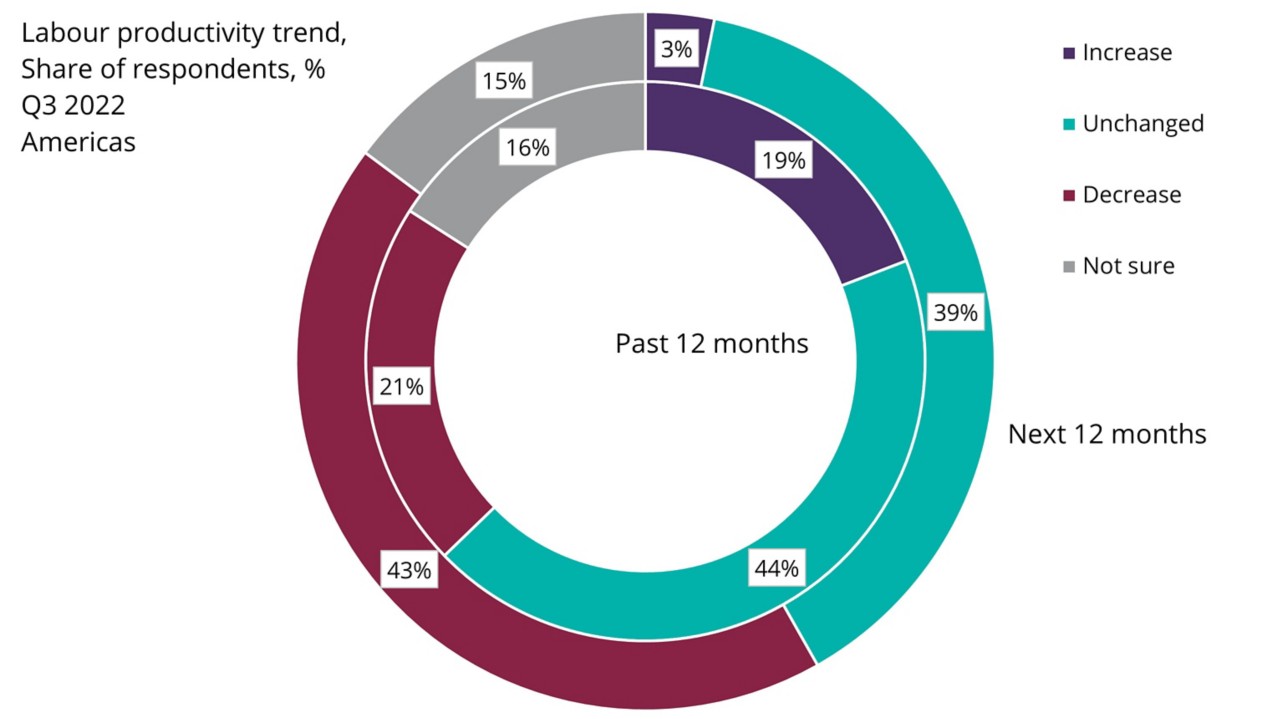
Figure 7: Productivity in the Americas
Figure 8 shows the labour productivity trends for APAC.
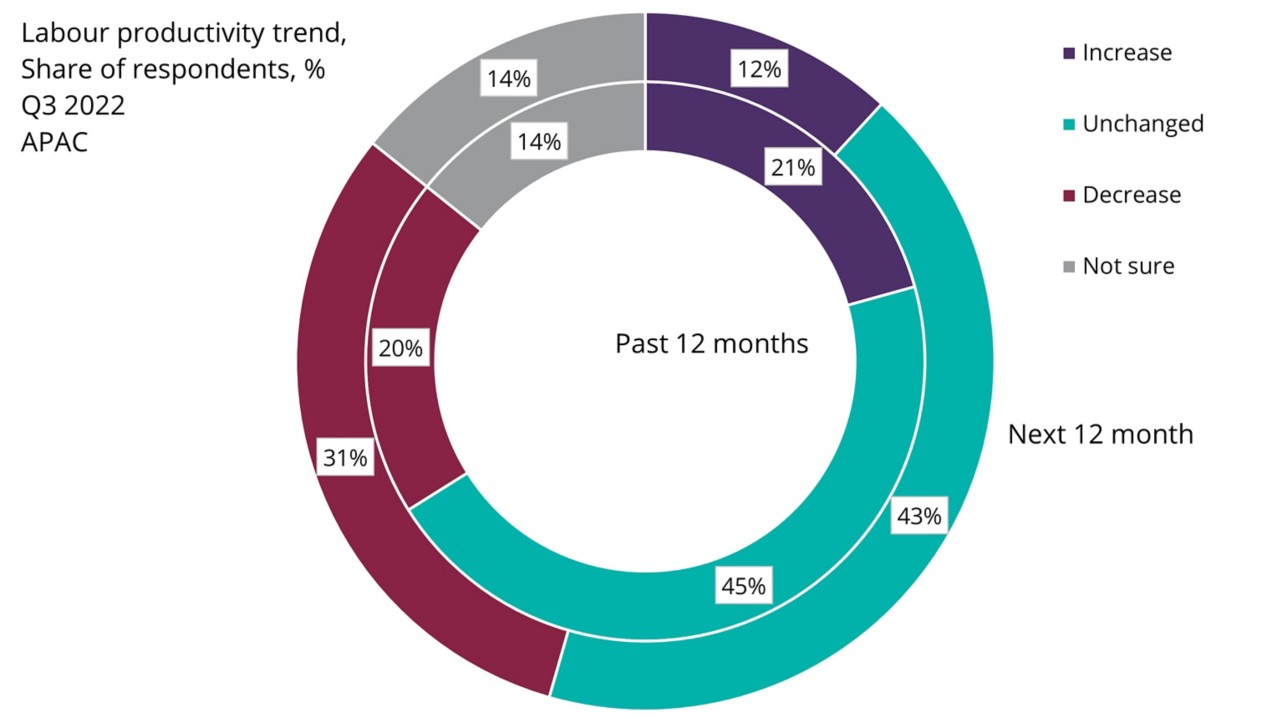
Figure 8: Productivity in APAC
2.3 Interventions to increase productivity
In the fourth question, the respondents were asked to select interventions they plan to use to increase labour productivity. Figure 9 shows the regional responses to these interventions.
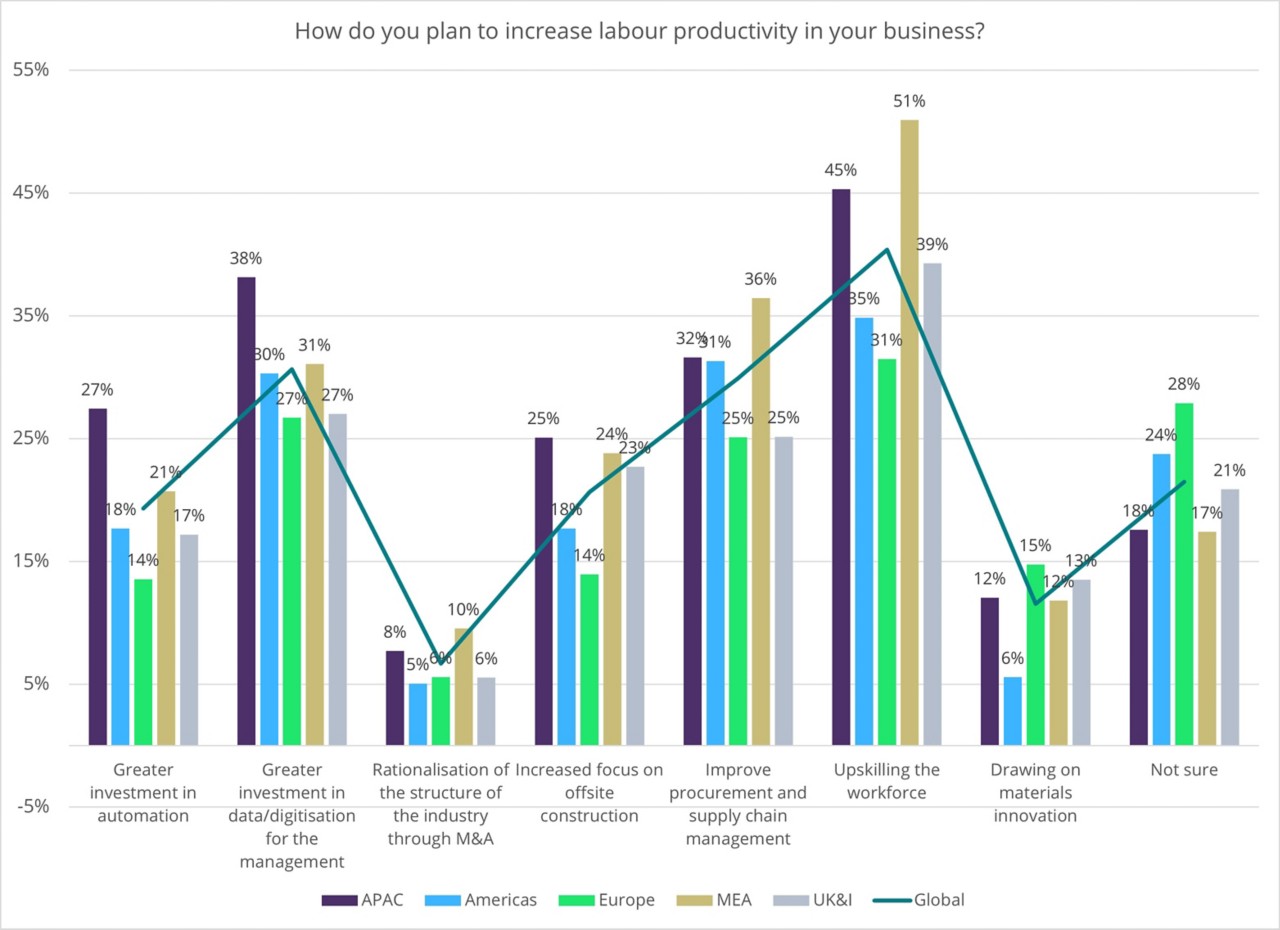
Figure 9: Interventions for improving labour productivity
At the global level, the following interventions were ranked as the top three:
- upskilling the workforce
- greater investment in data/digitisation
- improving procurement and supply chain management
Table 2 shows a comparison of the ranking of the interventions regionally. There is a minor misalignment in the rankings. In MEA and the Americas, ‘greater investment in data/digitisation’ is ranked number three, and ‘improve procurement and supply chain management’ is number two. There is consistency in the ranking of the interventions, with a few other exceptions.
How do you plan to increase labour productivity in your business |
Ranking |
|||||
APAC |
Americas |
Europe |
MEA |
UK&I |
Global |
|
Upskilling the workforce |
1 |
1 |
1 |
1 |
1 |
1 |
Greater investment in data/digitisation |
2 |
3 |
2 |
3 |
2 |
2 |
Improve procurement and supply chain management |
3 |
2 |
3 |
2 |
3 |
3 |
Increased focus on offsite construction |
5 |
4 |
5 |
4 |
4 |
4 |
Greater investment in automation |
4 |
4 |
6 |
5 |
5 |
5 |
Drawing on materials innovation |
6 |
6 |
4 |
6 |
6 |
6 |
Rationalisation of the structure of the industry through M&A |
7 |
7 |
7 |
7 |
7 |
7 |
Table 2: Ranking of productivity interventions by region
Conclusions
Productivity is an important metric for the construction sector. As part of the Q3 GCM 2022 survey, an initial assessment of important issues surrounding productivity was compiled. Over 25% of the respondents do not measure productivity regularly, and only 29% measure productivity quarterly. The data also shows regional variations in frequencies of measurement of labour productivity. Congruent with the current economic outlook and the state of the construction sector, there is a somewhat pessimistic view of productivity growth. Globally the number of respondents with an optimistic view of productivity dropped from 21%, stating an increase in productivity in the preceding 12 months, to 9%, stating an increase in productivity in the upcoming 12 months. This aligns with the Q3 GCM survey findings of construction activity, signalling a noticeable slowing in growth.
Regarding interventions to improve labour productivity, respondents suggested upskilling the workforce, investing in digital technologies and improving supply chain management as their top three choices. These findings align with RICS’ Digitalisation in construction 2023 and 2022 reports. Given the importance of construction productivity, RICS is planning to incorporate these questions into the GCM survey on an annual basis and report the results.